Tools used:
ARC View 3.1 GIS software
Microtrak yield monitor & Soil Trak data
Earthscan Satellite imagery

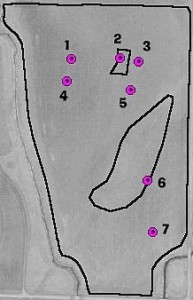
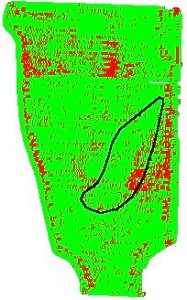
 To the left is an ortho aerial image taken on 4/3/1990 at 6100 meters.

There are 2 areas marked out in black.
The top one is a low yield area.
The bottom area is where we sprayed for Bean Leaf Beetle on August 2, 1999

The magenta points are post harvest yield loss checks. (make note of # 1, 2 & 3)
#1 = 3.6 bu/A
#2 = 11.4 bu/A
#3 = 5.77 bu/A

#4 = 1.9 bu/A
#5 = 1.75 bu/A
#6 = 2.47 bu/A
#8 = 1.26 bu/A

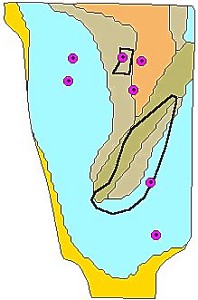
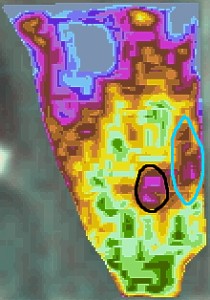
 This is an Iowa Soils map.

The blue is flood bottom (133 Colo soil).

The blue highlighted image is the suspicious #2 spot.
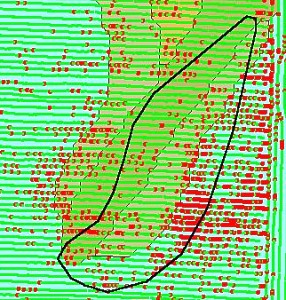
About 65% of the area highlighted in yellow yielded 44 bu/A. The post harvest yield loss check confirms the 2 varieties yielded the same and the lower yield was due to combine loss.
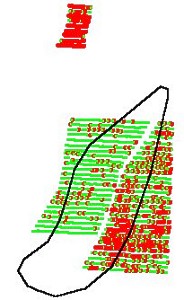
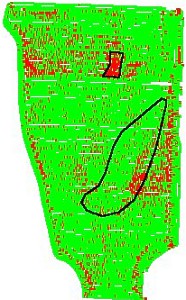
 This is a 1999 soybean yield map.
Red points represent yield up to 39 bu/A.
Green 39 and above.

This 75 acre field averaged 48 bu/A

The area marked on top is a suspicious low yield area.
After looking at the yield map we first thought the problem was from bean leaf beetle activity.

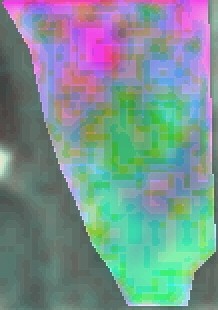
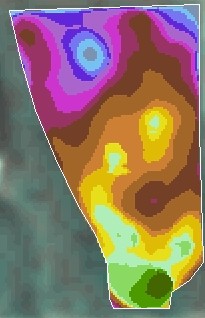
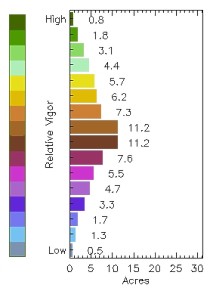
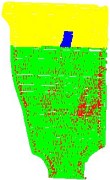
The north part of this field is a different variety (as highlighted in yellow on the smaller image to the left) and was planted about 1 week later. A tile line was severed while adding more tile last fall so water was ponding on the NW part of this field this spring which delayed planting.

This wet soil shows up as lower plant vigor on an Earthscan image below.

At harvest we adjusted the combine many times attempting to get the soybeans out of the pods completely.
The post harvest yield loss shows we needed to wait for the stems and pods to mature more.
#2 = 11.4 bu/A loss

 The yield image on top (#2 area) is .55 acres and yielded 34.9 bu/A We didn't notice any BLB activity here during the growing season.

The next 2 areas show the difference on bean leaf beetle activity and less BLB activity.

The area to the left is 4.16 acres and yielded 50.24 bu/A

The area to the right is 4.45 acres and yielded 41.71 bu/A

The area marked out in black is where we sprayed for bean leaf beetle on August 2, 1999. This area is where you could see visible BLB leaf feeding from the road. We used the sweep net several times before August but the populations didn't seem high enough to justify spraying at that point.

It is in situations like these that Satellite imagery may have helped us decide if we should spray more or not spray at all.

Unfortunately since this was Earthscan's first year online we weren't able to get a full season of imagery with high resolution images. Below left is a low resolution natural color image taken on 7/15/1999 (we didn't subscribe with Earthscan until later this fall so these images could only be used to compare with fall yield data). Below right is a Vegetation green image created using Earthscan's online analyzing tools.

Fall yield map Note the area marked below which shows where we sprayed for bean leaf beetle on August 2nd. The bottom part of this area is where the most BLB activity was when we sprayed Aug 2nd and it showed up on July 15 Earthscan image to the right as the low vigor color of magenta which is circled in black.

Field variation map by Earthscan 7/15/1999

Note the gray area in the upper middle. This is the area where the tile line was severed and water ponded which caused the planting delay.


After spraying we assume the BLBs moved from the area marked in blue back towards the area marked in black which you can see on the yield map image on the left.

 The image to right is the vigor scale for the Earthscan Field variation image just above it.

When you overlay the yield map & sprayed area map over the soil type map it "appears" that the later generation BLB preferred to stay in the 133 Colo soil type (light blue area). They moved to the base of the hill and "appeared" to have stopped there.

It may be coincidence but it makes you wonder.


Below is a Production Zone map also based on the satellite image that was taken 7/15/99.
The production zone tool was first available in the spring of 2000.

Below is the Production zone map scale.

Back to ARK farm page
Shortcut to my Home page